This post shows how factories can use data from machines (things like downtime and production counts) to forecast a single, useful number called OEE (Overall Equipment Effectiveness). Predicting OEE helps plant managers spot problems earlier, schedule maintenance smarter, and keep lines running longer.
Why this matters?
A single, easy-to-understand metric, OEE, summarizes how well a machine is doing by combining three ideas:
- Availability: Was the machine running when it was supposed to?
- Performance: When it was running, did it run at the expected speed?
- Quality:Of the parts produced, how many were good?
OEE = Availability × Performance × Quality
The data (in simple terms)
Two main kinds of information come from factory IoT systems:
- Downtime events: records of when a machine stopped and why.
- Yield/production records: counts of units produced, defect counts, and timings.
Typical workflow:
- Pull the raw files (a common data format) from cloud storage.
- Turn them into a table-like structure so they’re easier to work with.
- Match the downtime and production records by machine and date so you can calculate daily metrics.
Preparing the data
- Remove columns that don’t help forecast OEE (for example, meta fields or timestamps that aren’t needed).
- Convert any list-like fields into simple text so they’re easier to analyze.
- Fill in missing values when it makes sense, or drop fields that are mostly empty.
- Combine records by date (e.g., daily aggregates) so each row represents one machine on one day.
Then, calculate the three OEE components from these cleaned figures: availability, performance, and quality, and multiply them to get the daily OEE.
How the three parts are calculated:
- Availability = 1 − (total downtime ÷ total planned running time)
(If a machine was planned to run for 8 hours and it was down for 1 hour, availability is 1 − 1/8 = 0.875 or 87.5%.) - Performance = (expected work based on ideal speed) ÷ (actual time taken)
(Roughly: how close the line ran to its ideal speed.) - Quality = good units ÷ total units produced
(If 980 out of 1,000 units are good, quality is 98%.) - OEE = Availability × Performance × Quality
(Gives a number between 0 and 1; multiply by 100 to get a percentage.)
How forecasting helps (what we build)
We aimed to forecast daily OEE so teams could:
- Detect downward trends before they become outages.
- Prioritize inspections and maintenance where forecasts show upcoming drops.
- Measure the impact of process changes (did OEE improve after tweaks?).
At a high level the pipeline looked like:
- Ingest raw IoT files from cloud storage.
- Clean & merge downtime + production data.
- Create daily metrics (availability, performance, quality, OEE).
- Check for obvious bad data or outliers and remove them.
- Forecast OEE using time-series techniques.
- Share predictions in dashboards and trigger alerts for risky machines.
What modeling approaches were used:
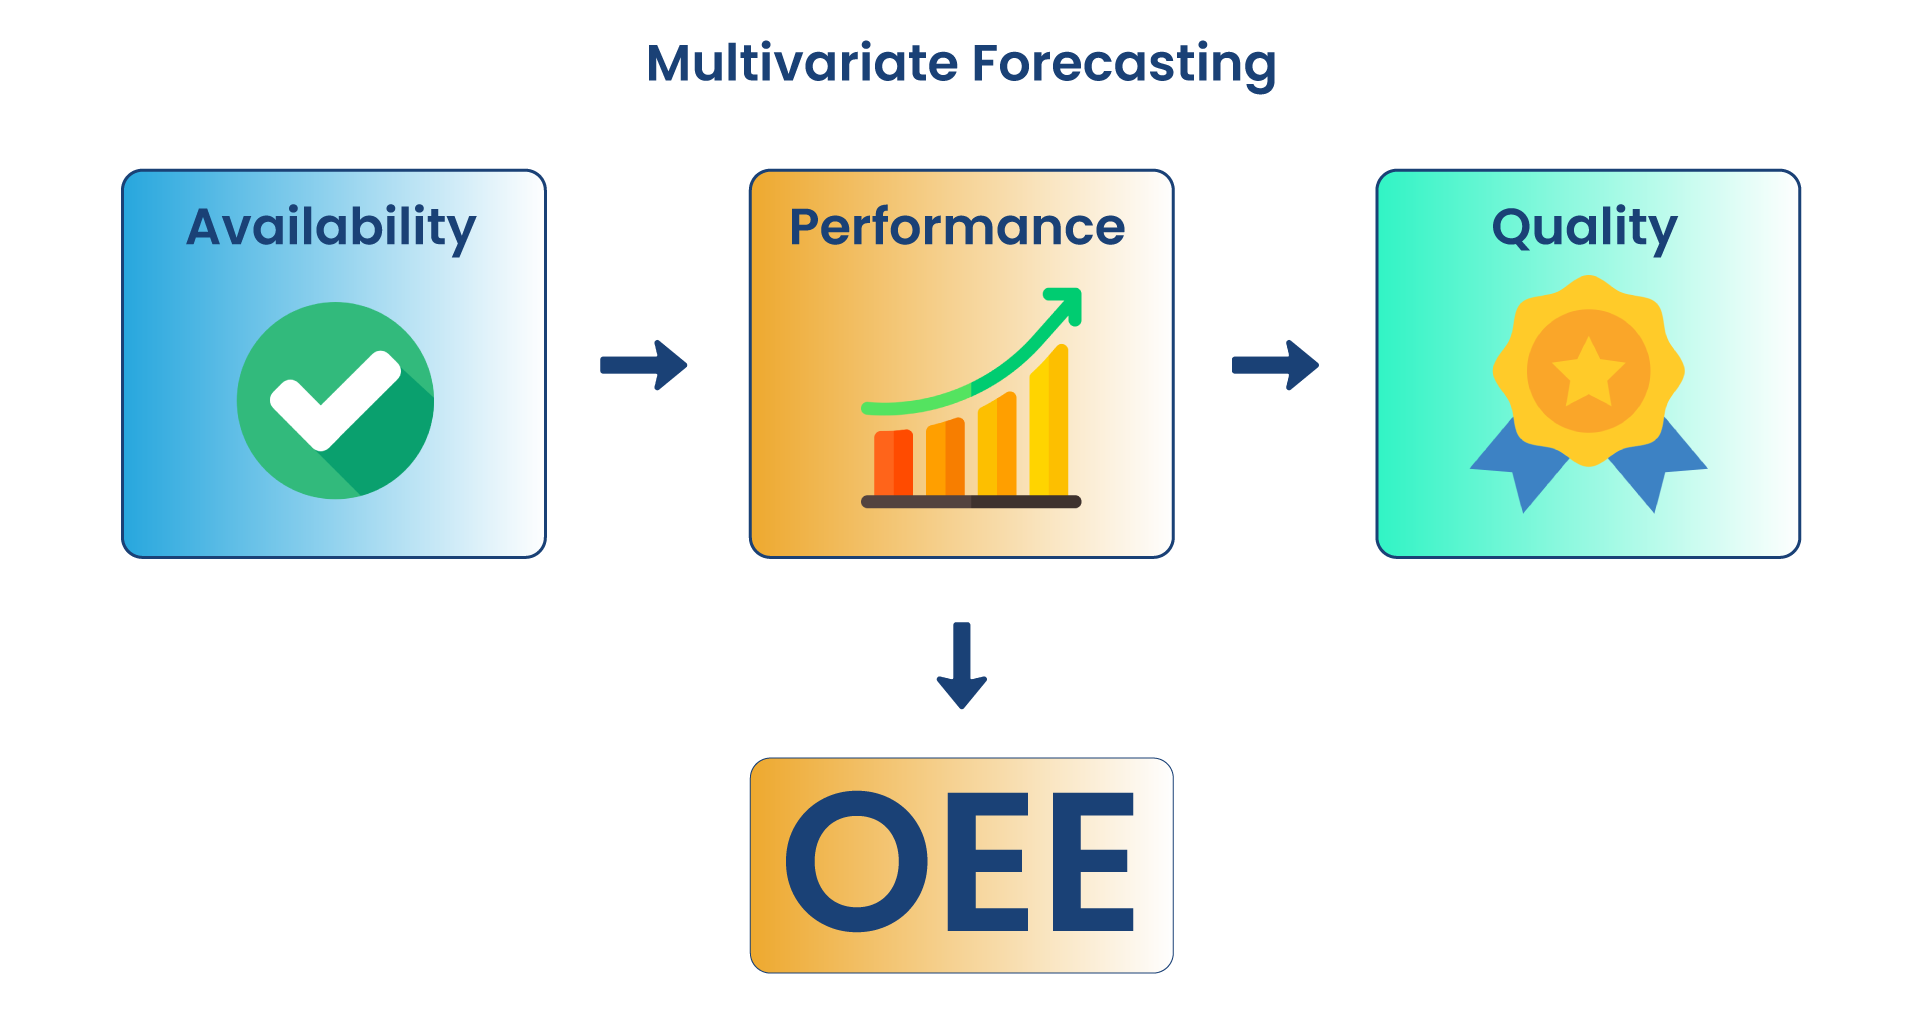
A multivariate model (used when predicting several related metrics together)
- Think of this as a model that looks at availability, performance, and quality together because they influence each other.
- This is useful when you want forecasts for all three components at once, not just OEE.
- It worked reasonably well, but sometimes missed seasonal patterns.

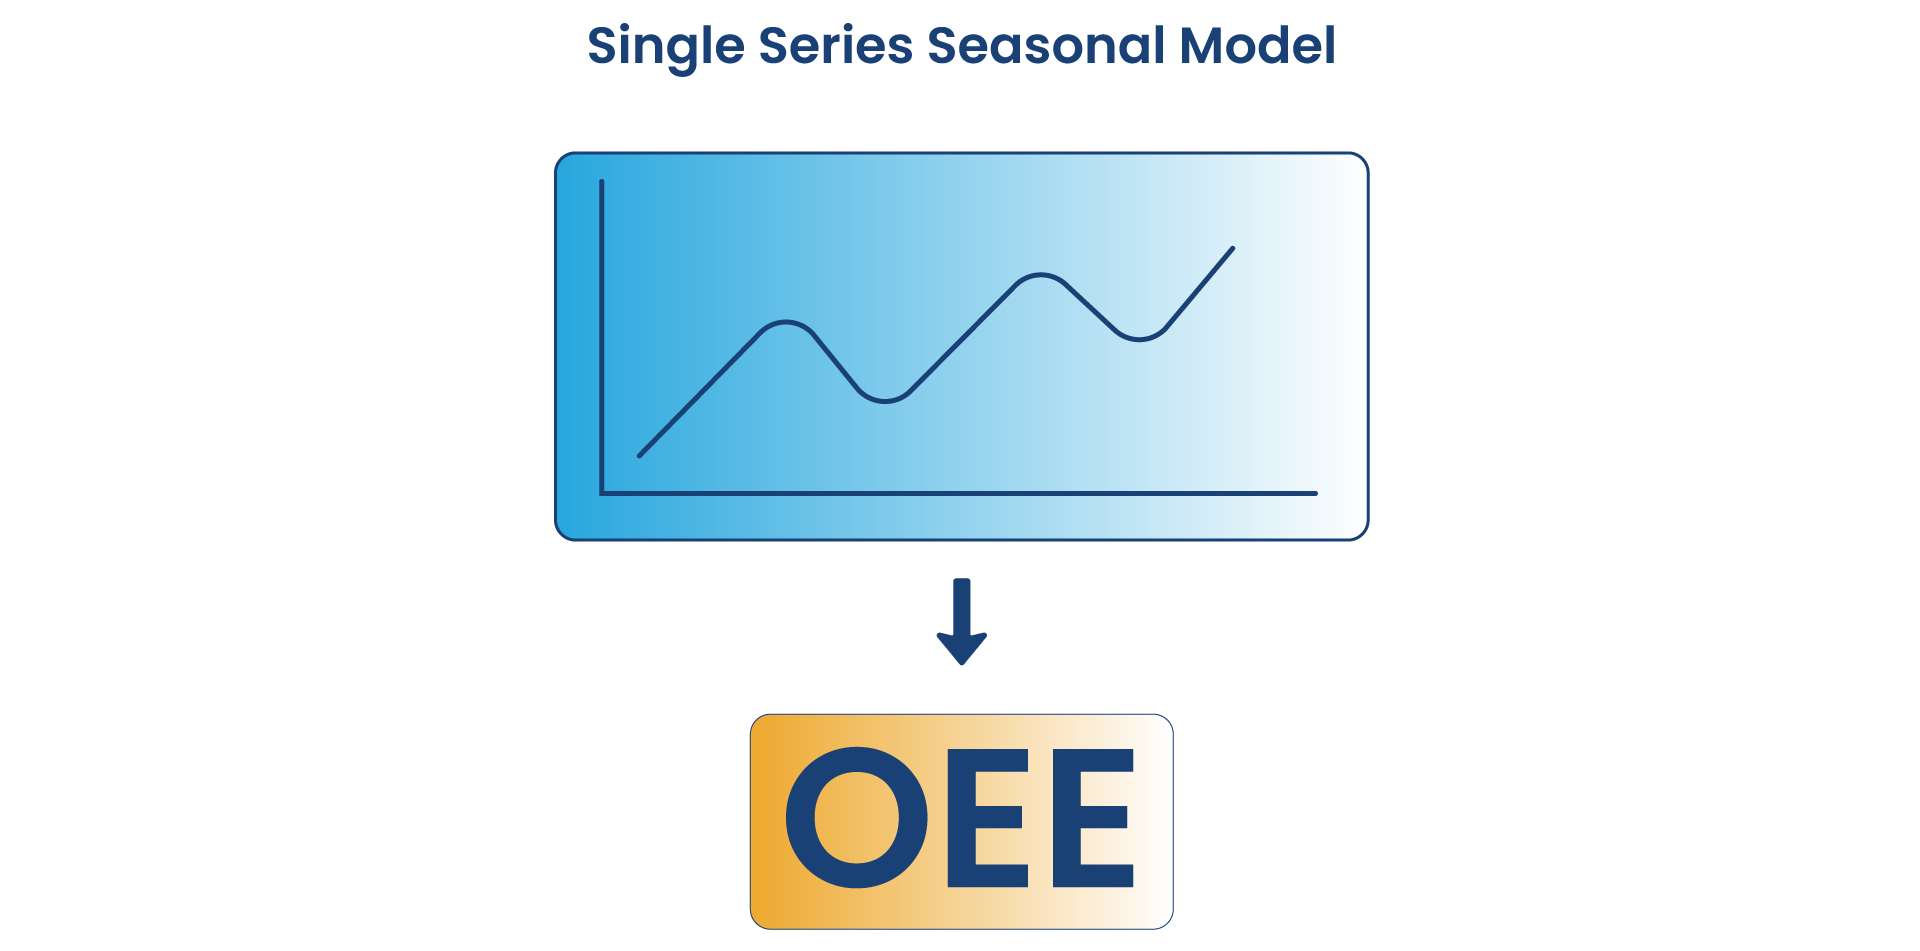
A single-series seasonal model (Holt–Winters)
- This approach focuses directly on the OEE number and is good at capturing seasonal patterns (daily/weekly cycles).
- In practice, this method produced the clearest forecasts for OEE and captured recurring patterns in the data.

Result in the sample run:
Practical takeaways
- Even noisy factory data can be turned into an actionable daily OEE forecast that operations teams understand.
- For forecasting a single business metric like OEE, models that capture seasonality tend to work best.
- For diagnosing root causes (is an OEE drop due to availability, performance, or quality?), multivariate approaches are valuable.
- Hosting the pipeline in cloud services (storage, modeling, dashboards) makes it easier to scale and share results across teams.
Final thought
About Us:
Founded in 1996, in Michigan, Youngsoft Inc. is an information technology company specializing in IT consulting, and staffing. For almost 3 decades, the company has delivered cutting-edge tech solutions like AEM, Liferay, Business Intelligence, and more to a global clientele. With a futuristic vision, Youngsoft has spearheaded innovations in Healthcare IT solutions and implemented Industry 4.0 in a Box program, a flagship IIoT initiative in partnership with AWS (Amazon Web Services).

